
Northbridge Consulting found $2.3M in unprofitable projects and flipped margin +17% with real-time project profitability tracking
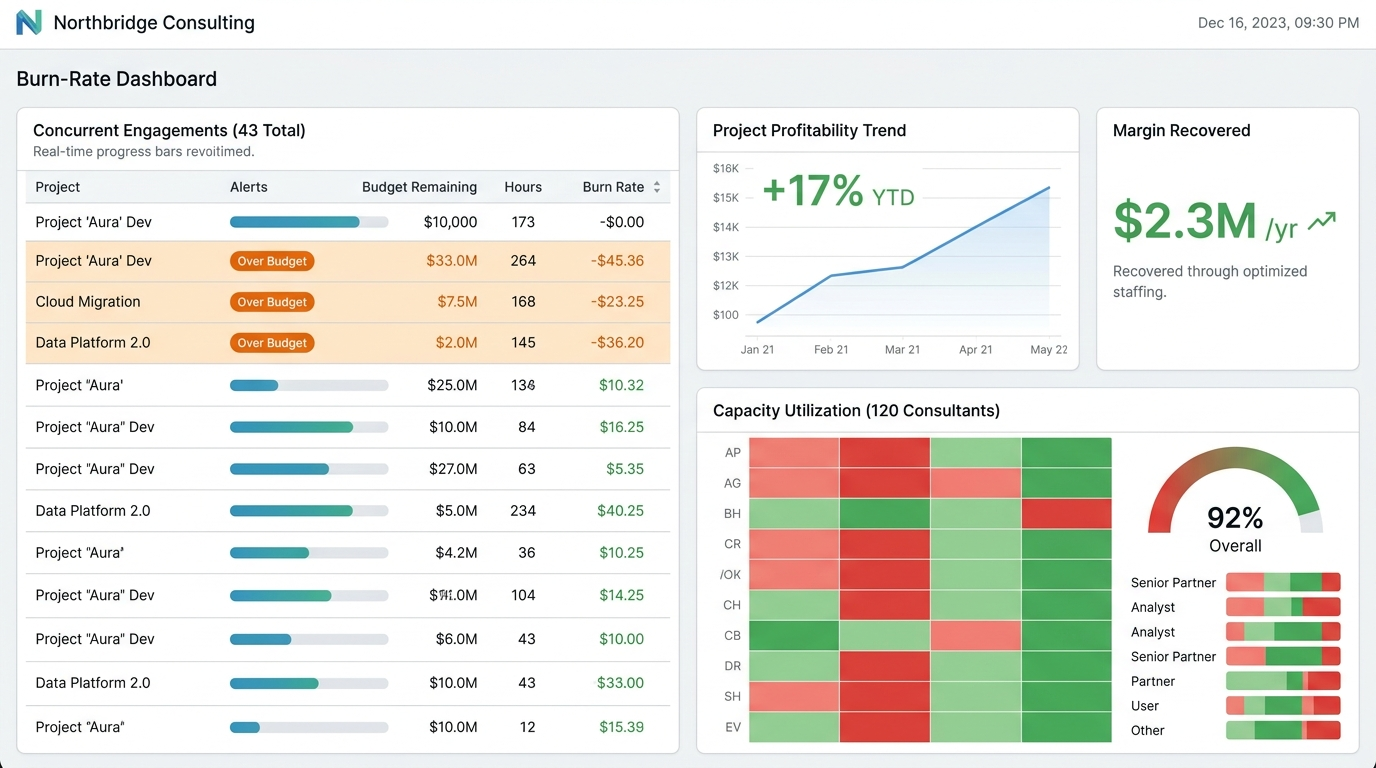
A 120-person management consultancy couldn't tell which engagements were making money until the quarter closed. A project management platform with real-time burn-rate dashboards revealed 28% of projects were losing money — and gave the partners the data to fix them before the damage compounded.
This is an illustrative case study. Company names, identifying details, and testimonials have been changed to protect client confidentiality. The technical solution and target outcomes are representative of the work we do. We extend the same confidentiality to every client.
Where they started
Northbridge's 120 consultants ran 40+ concurrent engagements across strategy, operations, and implementation work. Project managers tracked budgets in a shared workbook updated weekly, and profitability was a number the finance team computed at quarter-end — by which point the over-budget projects had already bled margin for three months. The last quarterly review surfaced a sobering pattern: 28% of projects were delivering below cost, and nobody had known until the numbers closed. The senior partners estimated they'd lost $2.3M in the prior year to projects that ran over on hours but billed flat fees, and resource allocation was a guessing game — the firm was turning down new work while bench consultants sat idle because no one had a real-time view of capacity.
What we built
We deployed our Project Hub platform with Gantt and board views wired into real-time time tracking, so every logged hour updates the project burn-rate dashboard the moment it's entered. Project profitability is now visible from day one: budget vs. actuals, remaining runway, and projected margin update live, and the system flags any project that crosses 80% budget burn with less than 60% of deliverables complete. Resource allocation dashboards show capacity across the entire firm — who's on the bench, who's over-allocated, and who's skills-available for the next engagement — so partners staff projects from real data instead of memory. The platform went live in 8 weeks and replaced the shared workbook, a separate capacity-planning tool, and the quarterly profitability report.
Target outcomes
More from this project
We ran an entire quarter not knowing a third of our projects were losing money. The first week the burn-rate dashboards went live, we caught two strategy engagements that were 40% over hours and still billing flat — we renegotiated both before the quarter closed. You can't fix what you can't see, and we'd been flying blind.
Representative testimonial — name and role changed to protect client identity.